
In the Positioning stage, Google Analytics (opens in a new tab) only needs to be installed. You install it early not to see numbers right away, but so your website starts to have a data history. Google Analytics records only the visits that happen after it is installed, so the day you install it is the day your data begins.
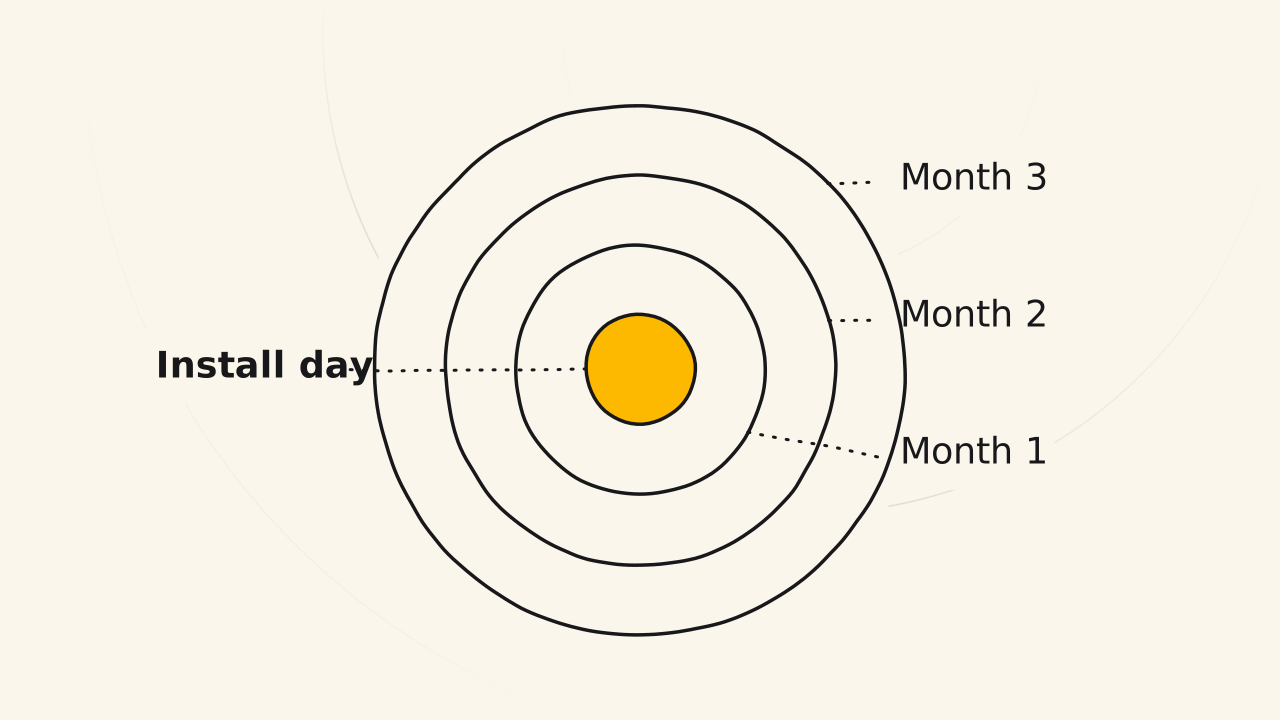
Why install it from the start?
If you install it in the first days, after 1, 2 or 3 months you have numbers to look at. With no data, you cannot tell whether anyone visits your website or clicks your content. If you wait 2 or 3 months to install it, your data starts from zero.
The install date cannot be moved back. The weeks before you install are weeks of data that are never recorded.
What can you measure later?
Once there is a history, Google Analytics shows you:
- Visits to your website.
- Where visits come from, for example search or AI tools.
- The path through the content funnel, to measure whether the funnel leads customers to your product.
You use these numbers mostly in stages 2 and 3. In stage 1, you only need to make sure Google Analytics is installed and recording.
How do you install it?
You create an account and a GA4 property in Google Analytics, then add that property’s tag to every page of your website. If your website runs on WordPress, the Site Kit by Google (opens in a new tab) plugin adds the tag for you, and also connects Search Console in the same setup.
To check it, open the real-time report and visit your own website. When that visit shows up, the tag works.1
Reading numbers in stage 2
In stage 2, you move from installing to learning to read Google Analytics. The main job is telling good signals from bad ones, starting with the simplest question, which is whether the website gets visits and whether anyone reads the content.
A website differs from social media in that it does not count readers for you. Social media shows numbers for each post, while a website needs a tool like Google Analytics to do that job.
You do not need to open Google Analytics every day. Opening it once a month is enough, because numbers need time to become a trend. While the website has no visits yet, you learn how to read it first. When visits arrive, you check that reading again to see which metrics matter and which ones you need to measure.
Measure conversion in stage 3
In stage 3, there are 2 kinds of conversion to measure, namely conversions into the gift funnel and sales conversions. These 2 kinds are measured in 2 different places.
| What you measure | Where |
|---|---|
| Conversions inside each funnel: content funnel, gift funnel, sales funnel | The tracking built into the funnel, no Google Analytics needed |
| The path from the content funnel to the gift funnel and to the sales funnel | Google Analytics |
The main work of Google Analytics lies outside the funnels. It shows how readers move from your articles to the sales page and the gift page. Along that path, the places where customers leave show where the funnel has a problem.
Find the funnel’s problem spots
A funnel has a problem where customers leave, and Google Analytics shows you those places. There are 2 signs to watch:
- Many customers leave on the product page. When many customers land on the product page and then leave, the page has a problem and does not sell. You optimize that page again, with an A/B test or by editing it yourself and saving each version.
- A low rate from the Love post to the sales funnel. The Love post is the last post of the content funnel. When few people go from the Love post to the sales funnel, readers do not yet love that post. What to do is revise the Love post.
Related pages
- Not about tracking indexing and searches: see Google Search Console.
- Not a guide to putting your website online: see Turn on indexing.